Now that you have a good understanding of the data, let's get back to our case study and build out the first element for the dashboard, Most Decorated Summer Athletes:

Your job is to create the base report for this element. Base report details:
- Column 1 should be
athlete_name. - Column 2 should be
gold_medals. - The report should only include athletes with at least 3 medals.
- The report should be ordered by gold medals won, with the most medals at the top.
-- Pull athlete_name and gold_medals for summer games
SELECT
a.name AS athlete_name,
sum(s.gold) AS gold_medals
FROM summer_games AS s
JOIN athletes AS a
ON s.athlete_id = a.id
GROUP BY a.name
-- Filter for only athletes with 3 gold medals or more
Having sum(s.gold) > 2
-- Sort to show the most gold medals at the top
ORDER BY gold_medals desc;
Important questions to ask before creating a report.
- what tables do we need to pull from ?
- how should we combine the tables ?
- what fields do we need to create?
- what filters need to be included?
- any ordering or limiting needed?
Steps to create the following chart
-Two joins
-Add Logic which is a case statement
-union
-order by
Option A
Step 1: Set up top query with join
Step 2: UNION ALL + set up the bottom query
Option B
Step 1: First Query the two tables in UNION
Step 2: Convert to subquery and Join with main table
JOIN then UNION query
Your goal is to create a report with the following fields:
- season, which outputs either
summer or winter - country
- events, which shows the unique number of events
There are multiple ways to create this report. In this exercise, create the report by using the JOIN first, UNION second approach.
Select
'winter' As season,
country,
count(distinct event) as events
from winter_games as w
join countries as c
on w.country_id = c.id
group by country
Union ALL -- "union all" keeps all records
--"union" keeps only unique records
Select
'summer' As season,
country,
count(distinct event) as events
from summer_games as s
join countries as c
on s.country_id = c.id
group by country /* you can also group by seasons too, but it
is not mandatory because we have only one type of distinct value
inside the seasons column */
but in the second option,
-- Add outer layer to pull season, country and unique events
SELECT
season,
country,
COUNT(DISTINCT event) AS events
FROM
-- Pull season, country_id, and event for both seasons
(SELECT
'summer' AS season,
country_id,
event
FROM summer_games
UNION ALL
SELECT
'winter' AS season,
country_id,
event
FROM winter_games) AS subquery
JOIN countries AS c
ON subquery.country_id = c.id
-- Group by any unaggregated fields
GROUP BY season, country
-- Order to show most events at the top
ORDER BY events DESC;
/* we must order by season because we have various types of distinct
values inside season... we have winter and also summer....
*/
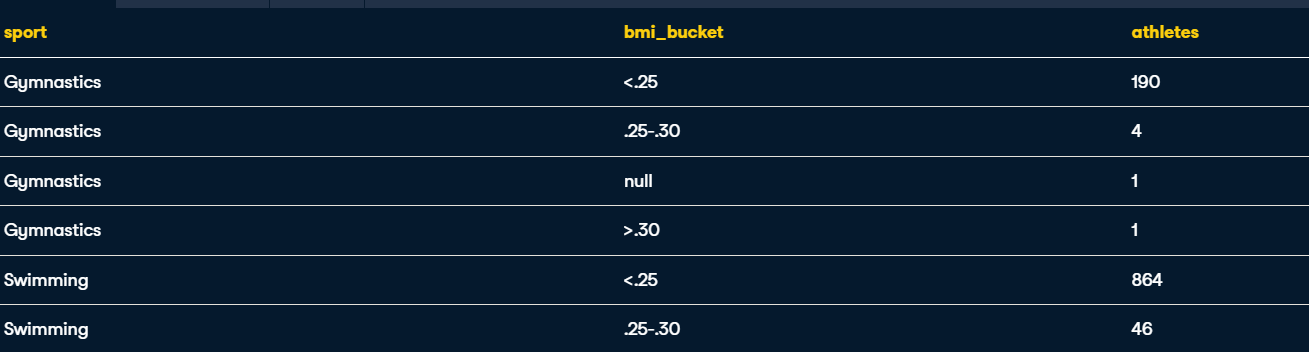
BMI bucket by sport
You are looking to understand how BMI differs by each summer sport. To answer this, set up a report that contains the following:
- sport, which is the name of the summer sport
- bmi_bucket, which splits up BMI into three groups:
<.25, .25-.30, >.30 - athletes, or the unique number of athletes
Definition: BMI = 100 * weight / (height squared).
Also note that CASE statements run row-by-row, so the second conditional is only applied if the first conditional is false. This makes it that you do not need an AND statement excluding already-mentioned conditionals.
-- Pull in sport, bmi_bucket, and athletes
SELECT
sport,
-- Bucket BMI in three groups: <.25, .25-.30, and >.30
CASE WHEN 100*weight/height^2 <.25 THEN '<.25'
WHEN 100*weight/height^2 <=.30 THEN '.25-.30'
WHEN 100*weight/height^2 >.30 THEN '>.30' END AS bmi_bucket,
COUNT(DISTINCT athlete_id) AS athletes
FROM summer_games AS s
JOIN athletes AS a
ON s.athlete_id = a.id
-- GROUP BY non-aggregated fields
GROUP BY sport, bmi_bucket --check explanation 2
-- Sort by sport and then by athletes in descending order
ORDER BY sport, athletes DESC;
/* explanation 1: we are first ordering by the sport, then we order by athletes
counts on the sport. It works like a partition by. Simply put, we
first order by sport and then inside the sport, we run order by
athletes. */
/* explanation 2: first we created groups of athletes by sport,
then we go inside the group
and create another level of group
which is bmi_bucket. Now the same group is further divided into
more four groups. */
It is very interesting how it works. If we look closely we see a lot of null values. There is another bucket as null which we did not create. So is it the case. Lets find out in the following three steps.
Step 1:
-- Show height, weight, and bmi for all athletes
SELECT
height,
weight,
100*weight/height^2 AS bmi
FROM athletes
-- Filter for NULL bmi values
WHERE 100*weight/height^2 is null;
-- where statements cannot pull aliases.
-- write the entire calculation
We see that our weight is null, there fore the calculation returned null.
Now we can go back to our original query and tell the world that if weight value is null,
no value is recorded.
-- Uncomment the original query
SELECT
sport,
CASE WHEN weight/height^2*100 <.25 THEN '<.25'
WHEN weight/height^2*100 <=.30 THEN '.25-.30'
WHEN weight/height^2*100 >.30 THEN '>.30'
-- Add ELSE statement to output 'no weight recorded'
Else 'no weight recorded' END AS bmi_bucket,
-- no value is recorded for the weight so we are saying this
-- some bmi will return in null
-- so we will have an extra bucket for the null.
COUNT(DISTINCT athlete_id) AS athletes
FROM summer_games AS s
JOIN athletes AS a
ON s.athlete_id = a.id
GROUP BY sport, bmi_bucket
ORDER BY sport, athletes DESC;
Next Up, we want to be able to prepare the following table in the picture.
/* before tackling this query, we need to follow devide and conquer strategy here
first summer and later winter
*/
-- Pull event and unique athletes from summer_games
SELECT
event,
-- Add the gender field below
CASE WHEN event LIKE '%Women%' THEN 'female'
ELSE 'male' END AS gender,
COUNT(DISTINCT athlete_id) AS athletes
FROM summer_games
-- Only include countries that won a nobel prize
WHERE country_id IN -- country_id from summer_games
(SELECT country_id -- country_id from country_stats
FROM country_stats
WHERE nobel_prize_winners > 0)
/* because we want to get athletes from countries that
has owned nobel prize at least once.
the whole table is about players who's country has
at least one nobel prize winner */
GROUP BY event
-- Add the second query below and combine with a UNION
UNION
SELECT
event,
Case when event like '%Women%' Then 'female'
Else 'male' End as gender,
count(distinct athlete_id) as athletes
FROM winter_games
WHERE country_id IN
(SELECT country_id
FROM country_stats
WHERE nobel_prize_winners > 0)
GROUP BY event
-- Order and limit the final output
ORDER BY athletes desc
-- order by and limit are universally applied
-- to both parts of UNION. 1st and 2nd.
LIMIT 10; --limit to first 10 events with highest athletes.
Cleaning strings
How we can take it to the next level?
We can combine all of them into one nested query.
This one query tells you everything you need to do for cleaning the columns.
Let's say you want to clean data.
-- Pull event and unique athletes from summer_games_messy
SELECT
-- Remove dashes from all event values
replace(TRIM(event), '-', '') AS event_fixed,
-- we used trim to remove spaces.
-- later replaced - with nothing.
COUNT(DISTINCT athlete_id) AS athletes
FROM summer_games_messy
-- Update the group by accordingly
GROUP BY event_fixed;
Measuring the Impact of Null
Ration of rows that are null.
select
sum(Case When country IS NULL then 1 else 0 end) / Sum(1.0)
result >>> .12
---
first we want to see how many null values we have.
we sum all the null values represented as 1.
-- Show total gold_medals by country
SELECT
country,
SUM(gold) AS gold_medals
FROM winter_games AS w
JOIN countries AS c
ON w.country_id = c.id
-- Comment out the WHERE statement
--WHERE gold IS NOT NULL
GROUP BY country
-- Replace WHERE statement with equivalent HAVING statement
HAVING sum(gold) is not null
-- we are removing values and groups with null
-- Order by gold_medals in descending order
ORDER BY gold_medals DESC;
-- Pull events and golds by athlete_id for summer events
SELECT
athlete_id,
-- Replace all null gold values with 0
AVG(coalesce(gold, 0)) AS avg_golds,
-- we replaced null with zero using coalesce(fieldname, and
--value_to_replace_with)
-- you can use coalesce to replace null value with anything you want.
COUNT(event) AS total_events,
SUM(gold) AS gold_medals
FROM summer_games
GROUP BY athlete_id
-- Order by total_events descending and athlete_id ascending
ORDER BY total_events DESC, athlete_id;
Identifying Duplication, Checking with a subquery,
Step1:
SELECT SUM(gold) AS gold_medals
FROM winter_games;
Step2:
SELECT SUM(gold_medals) AS gold_medals
FROM
( SELECT
w.country_id,
w.gold as gold_medals,
AVG(gdp) AS avg_gdp
FROM winter_games AS w
JOIN country_stats AS c
-- Update the subquery to join on a second field
ON c.country_id = w.country_id
GROUP BY w.country_id, w.gold) as subquery;
Report 3: Countries with high medal rates
Great work so far! It is time to use the concepts you learned in this chapter to build the next base report for your dashboard.
Details for report 3: medals vs population rate.
- Column 1 should be
country_code, which is an altered version of the country field. - Column 2 should be
pop_in_millions, representing the population of the country (in millions). - Column 3 should be
medals, representing the total number of medals. - Column 4 should be
medals_per_million, which equals medals / pop_in_millions
SELECT
c.country,
-- Pull in pop_in_millions and medals_per_million
cs.pop_in_millions,
-- Add the three medal fields using one sum function
SUM(COALESCE(bronze,0) + COALESCE(silver,0) +
COALESCE(gold,0)) AS medals,
SUM(COALESCE(bronze,0) + COALESCE(silver,0) +
COALESCE(gold,0))/Cast(cs.pop_in_millions as float)
AS medals_per_million
/* this Sum and + helps add values of
columns side by side */
FROM summer_games AS s
JOIN countries AS c
ON s.country_id = c.id
-- Add a join
JOIN country_stats AS cs
ON s.country_id = cs.country_id
GROUP BY c.country, cs.pop_in_millions
/*
Group By X means put all those with the
same value for X in the one group.
Group By X, Y means put all those with the
same values for both X and Y in the one group.
*/
/*
If we have an aggregations in the select statement
we must have all the remaining non aggregated once
in the grouping clause
*/
ORDER BY medals asc;
Window Functions:
SELECT
country_id,
year,
gdp,
-- Show the average gdp across all years per country
avg(gdp) over(partition by country_id) AS country_avg_gdp
FROM country_stats;
Most decorated athlete per region
Your goal for this exercise is to show the most decorated athlete per region. To set up this report, you need to leverage the ROW_NUMBER() window function, which numbers each row as an incremental integer, where the first row is 1, the second is 2, and so on.
Syntax for this window function is ROW_NUMBER() OVER (PARTITION BY field ORDER BY field). Notice how there is no argument within the initial function.
When set up correctly, a row_num = 1 represents the most decorated athlete within that region. Note that you cannot use a window calculation within a HAVING or WHERE statement, so you will need to use a subquery to filter.
Feel free to reference the E:R Diagram. We will use summer_games_clean to avoid null handling.
-- Query region, athlete name, and total_golds
SELECT
region,
athlete_name,
total_golds
FROM
(SELECT
-- Query region, athlete_name, and total gold medals
region,
name AS athlete_name,
SUM(gold) AS total_golds,
-- Assign a regional rank to each athlete
-- meaning who has the top performer in this region
-- meaning who won most gold medals in " "
ROW_NUMBER() OVER (PARTITION BY region ORDER BY SUM(gold) DESC) AS row_num
/* we have sum(gold)
because we need to add all the
golds a particular player has won */
FROM summer_games_clean AS s
JOIN athletes AS a
ON a.id = s.athlete_id
JOIN countries AS c
ON s.country_id = c.id
-- Alias as subquery
GROUP BY region, athlete_name) AS subquery
/* always need to
put all the unaggregated columns
inside the group by if
there exists any aggregated column. */
-- Filter for only the top athlete per region
WHERE row_num = 1;
-- because we are selecting the top for every region.
### memorise this line
SUM(gdp) / SUM(SUM(gdp)) OVER (partition by region)
### memorise this line
### sum of a sum is needed when we have group by in our query.
-- Pull country_gdp by region and country
SELECT
region,
country,
--calculate the gdp for each country
SUM(gdp) AS country_gdp,
-- Calculate the global gdp
-- calculate the global gdp adding gdp of each country
SUM(SUM(gdp)) OVER () AS global_gdp,
-- Calculate percent of global gdp
-- what parcent is sum(gdp) of global total gdp?
SUM(gdp) / SUM(SUM(gdp)) OVER () AS perc_global_gdp,
-- Calculate percent of gdp relative to its region
-- what parcent is sum(gdp) of regional total gdp?
SUM(gdp) / SUM(SUM(gdp)) OVER (partition by region) AS perc_region_gdp
FROM country_stats AS cs
JOIN countries AS c
ON cs.country_id = c.id
-- Filter out null gdp values
WHERE gdp IS NOT NULL
GROUP BY region, country
-- Show the highest country_gdp at the top
ORDER BY country_gdp DESC;
Efficiency Measure
-- Bring in region, country, and gdp_per_million
SELECT
region,
country,
SUM(gdp) / SUM(pop_in_millions) AS gdp_per_million,
-- Output the worlds gdp_per_million
SUM(SUM(gdp)) OVER () / SUM(SUM(pop_in_millions)) OVER ()
AS gdp_per_million_total,
-- Build the performance_index in the 3 lines below
-- first we will get the avg performance of each country
-- then we will get the avg performance of the whole world
/* -- the we will find the
each country avg performance percentage on
whole world performance */
(sum(gdp)/sum(pop_in_millions))
/
(sum(sum(gdp)) over() / sum(sum(pop_in_millions)) over ())
AS performance_index
-- Pull from country_stats_clean
FROM country_stats_clean AS cs
JOIN countries AS c
ON cs.country_id = c.id
-- Filter for 2016 and remove null gdp values
WHERE year = '2016-01-01' AND gdp IS NOT NULL
GROUP BY region, country
-- Show highest gdp_per_million at the top
ORDER BY gdp_per_million DESC;
dates are really complicated.
week over week comparision
step by step
SELECT
-- Pull in date and daily_views
date,
SUM(views) AS daily_views,
avg(sum(views)) over (order by date Rows Between 6
preceding and current row) AS weekly_avg
/* we have avg of the sum of views
because we already have a group by function and
another existing aggregation */
FROM web_data
GROUP BY date;
SELECT
-- Pull in date and weekly_avg
date,
weekly_avg,
-- Output the value of weekly_avg from 7 days prior
LAG(weekly_avg,7) OVER (ORDER BY date) AS weekly_avg_previous,
/* to find the weekly avg going back 7 days,
we need to use lag
bcz we alreay found the avg, we just need
to go back to that 7 days */
-- Calculate percent change vs previous period
weekly_avg/ LAG(weekly_avg,7) OVER (ORDER BY date) -1
AS perc_change
FROM
(SELECT
-- Pull in date and daily_views
date,
SUM(views) AS daily_views,
-- Calculate the rolling 7 day average
AVG(SUM(views)) OVER (ORDER BY date
ROWS BETWEEN 6 PRECEDING AND CURRENT ROW) AS weekly_avg
/* order by without partition because
we just have the date for the entire table
no other column grouped the date;
in a situation where we have partition by,
we will see null will occur everytime
there is a new partition or group. */
FROM web_data
-- Alias as subquery
GROUP BY date) AS subquery
-- Order by date in descending order
ORDER BY date DESC;
Report 4: Tallest athletes and % GDP by region
The final report on the dashboard is Report 4: Avg Tallest Athlete and % of world GDP by Region.
Report Details:
- Column 1 should be
region found in the countries table. - Column 2 should be
avg_tallest, which averages the tallest athlete from each country within the region. - Column 3 should be
perc_world_gdp, which represents what % of the world's GDP is attributed to the region. - Only
winter_games should be included (no summer events).
Step 1:
SELECT
-- Pull in country_id and height
country_id,
height,
-- Number the height of each country's athletes
row_number() over
(partition by country_id order by height DESC)
AS row_num
FROM winter_games AS w
JOIN athletes AS a
ON a.id = w.athlete_id
GROUP BY country_id, height
-- Order by country_id and then height in descending order
ORDER BY country_id, height DESC;
SELECT
-- Pull in region and calculate avg tallest height
region,
AVG(height) AS avg_tallest,
-- Calculate region's percent of world gdp
/* sum(gdp) will give you the sum of
based on group by...
sum of the sum(gdp) over () will
give you the sum of the whole
column data. */
SUM(gdp)/SUM(SUM(gdp)) OVER () AS perc_world_gdp
FROM countries AS c
JOIN
(SELECT
-- Pull in country_id and height
country_id,
height,
-- Number the height of each country's athletes
ROW_NUMBER() OVER (PARTITION BY country_id ORDER BY height
DESC) AS row_num
FROM winter_games AS w
JOIN athletes AS a ON w.athlete_id = a.id
GROUP BY country_id, height
-- Alias as subquery
ORDER BY country_id, height DESC) AS subquery
ON c.id = subquery.country_id
-- Join to country_stats
JOIN country_stats AS cs
ON cs.country_id = c.id
-- Only include the tallest height for each country
WHERE row_num = 1
GROUP BY region;